nullobjRMM: A Self-Hosted Tool That Actually Gets It Right
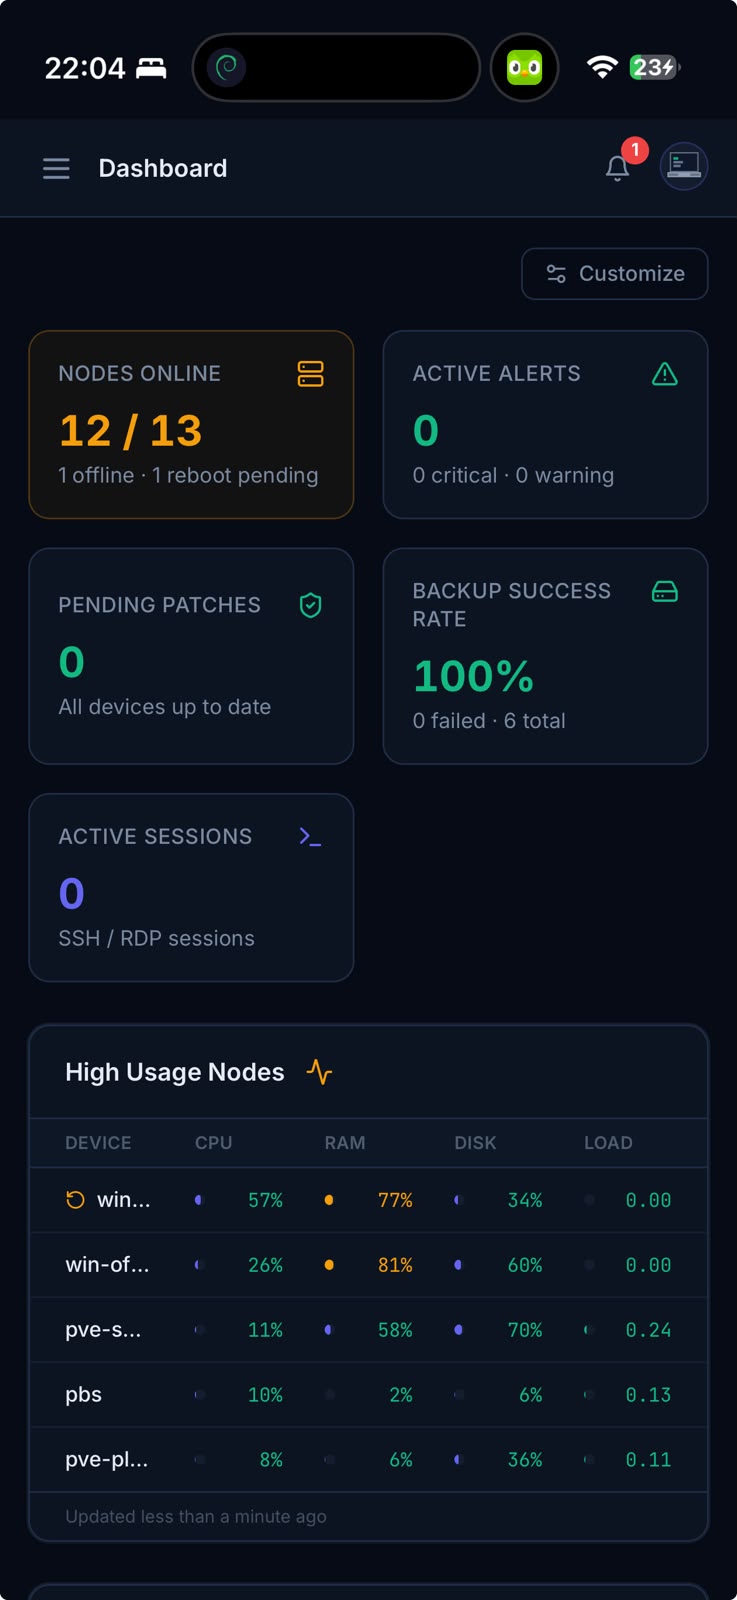
It is rare that a piece of homelab software makes you sit back and think, yes, this is exactly what I needed and did not know how to ask for. The remote monitoring and management space has always been dominated by enterprise tools that cost a small fortune, require a dedicated server to run, and treat the solo sysadmin like an afterthought. Yet nullobjRMM, built from the ground up for people who run their own infrastructure at home or in small businesses, manages to feel genuinely thoughtful in a way that most tools in this category simply do not.
The pitch is straightforward enough. You have a handful of machines, maybe some Proxmox hosts running virtual machines, a few Debian or Ubuntu boxes, perhaps a Windows node or two, a Proxmox Backup Server keeping everything safe, and a Pi-hole quietly filtering DNS requests somewhere on the network. You want to keep an eye on all of it without logging into six different web interfaces or writing your own collection of bash scripts that inevitably break at the worst possible moment. nullobjRMM puts all of that under one roof, and the roof is surprisingly sturdy.
The architecture is genuinely clever. The backend runs entirely on Cloudflare Workers, which means there is no server to maintain, no VPS bill to worry about, and no single point of failure sitting in your cupboard waiting to overheat. A lightweight Go agent installs on each node you want to monitor, connects outward to the worker over a persistent WebSocket, and starts streaming metrics back almost immediately. CPU usage, RAM, disk space, load averages, temperature sensors, network throughput, the whole picture arrives in seconds and refreshes constantly. The dashboard shows you a live heat map of your fleet and makes it immediately obvious when something is wrong.
The alert system is where things get genuinely useful. High CPU, high RAM and disk usage all trigger warnings automatically, and crucially they resolve themselves automatically too, with a toast notification sliding in to tell you the situation has calmed down. There is a notification bell in the top bar that tracks offline nodes, active alerts, pending patches and failed backups, and it updates the PWA badge on your phone's home screen when issues need attention. That last detail is a small thing but it is the kind of small thing that separates software built by someone who actually uses it from software built to a feature list.
Backup monitoring deserves a mention of its own. The Proxmox Backup Server integration pulls task logs, datastore usage, snapshot histories and job schedules into a single view. Failed backup alerts fire only for actual backup job types, which sounds obvious but is the sort of thing many tools get embarrassingly wrong, flagging terminal sessions and package updates as backup failures because nobody bothered to check the task type field. Here that distinction is made correctly, and the alert resolves cleanly once the underlying situation improves.
The patch management side is similarly well considered. The system scans all your Linux nodes for available updates, groups them into a matrix view, and lets you apply patches remotely through the dashboard. There is a script library too, pre-loaded with useful diagnostics and agent management commands, accessible via a snippets panel in the built-in SSH terminal. That terminal, powered by xterm.js and proxied through Cloudflare Durable Objects, connects to any online node with a single click and handles resize events, clipboard paste and UTF-8 input without fuss.
Proxmox support goes deeper than simple ping monitoring. The Hosts page shows all your PVE and PBS nodes with full resource stats, VM and container inventories pulled live from the Proxmox API, ZFS pool status, SMART data, running services and backup job schedules. There is a major version upgrade checker that runs daily, flags pre-upgrade issues with one-click fixes for common blockers like missing microcode packages and LVM autoactivation problems, and then executes the actual dist-upgrade remotely when you are ready, with streaming output so you can watch the process in real time.
Agentless VMs discovered through Proxmox get their own visibility controls. You can hide individual VMs from the dashboard without losing their data, and the node count on the summary card correctly reflects only the machines you actually care about rather than every ephemeral test VM you span up last Tuesday.
Pi-hole nodes are auto-detected by the agent when it finds the binary installed, the running version is reported back and compared against the latest GitHub release daily, and an alert fires if you are running behind.
The whole thing installs in a few minutes per node, runs as a systemd service, and updates itself remotely through the dashboard when a new agent build is available. For anyone managing a small fleet of machines and tired of cobbling together Grafana dashboards, Uptime Kuma instances and manual SSH sessions, nullobjRMM is the kind of tool that makes you wonder why you waited so long.